These Are The Most Accident-Prone Cars In America
Certain vehicles tend to show up in crash statistics more often than others, but why?
There are many factors that play a role in how frequently a model is involved in accidents, including driver demographics, size, and even color.
In this infographic, Visual Capitalist’s Marcus Lu ranks America’s most accident prone car models using data compiled by Insurify.
Data and Discussion
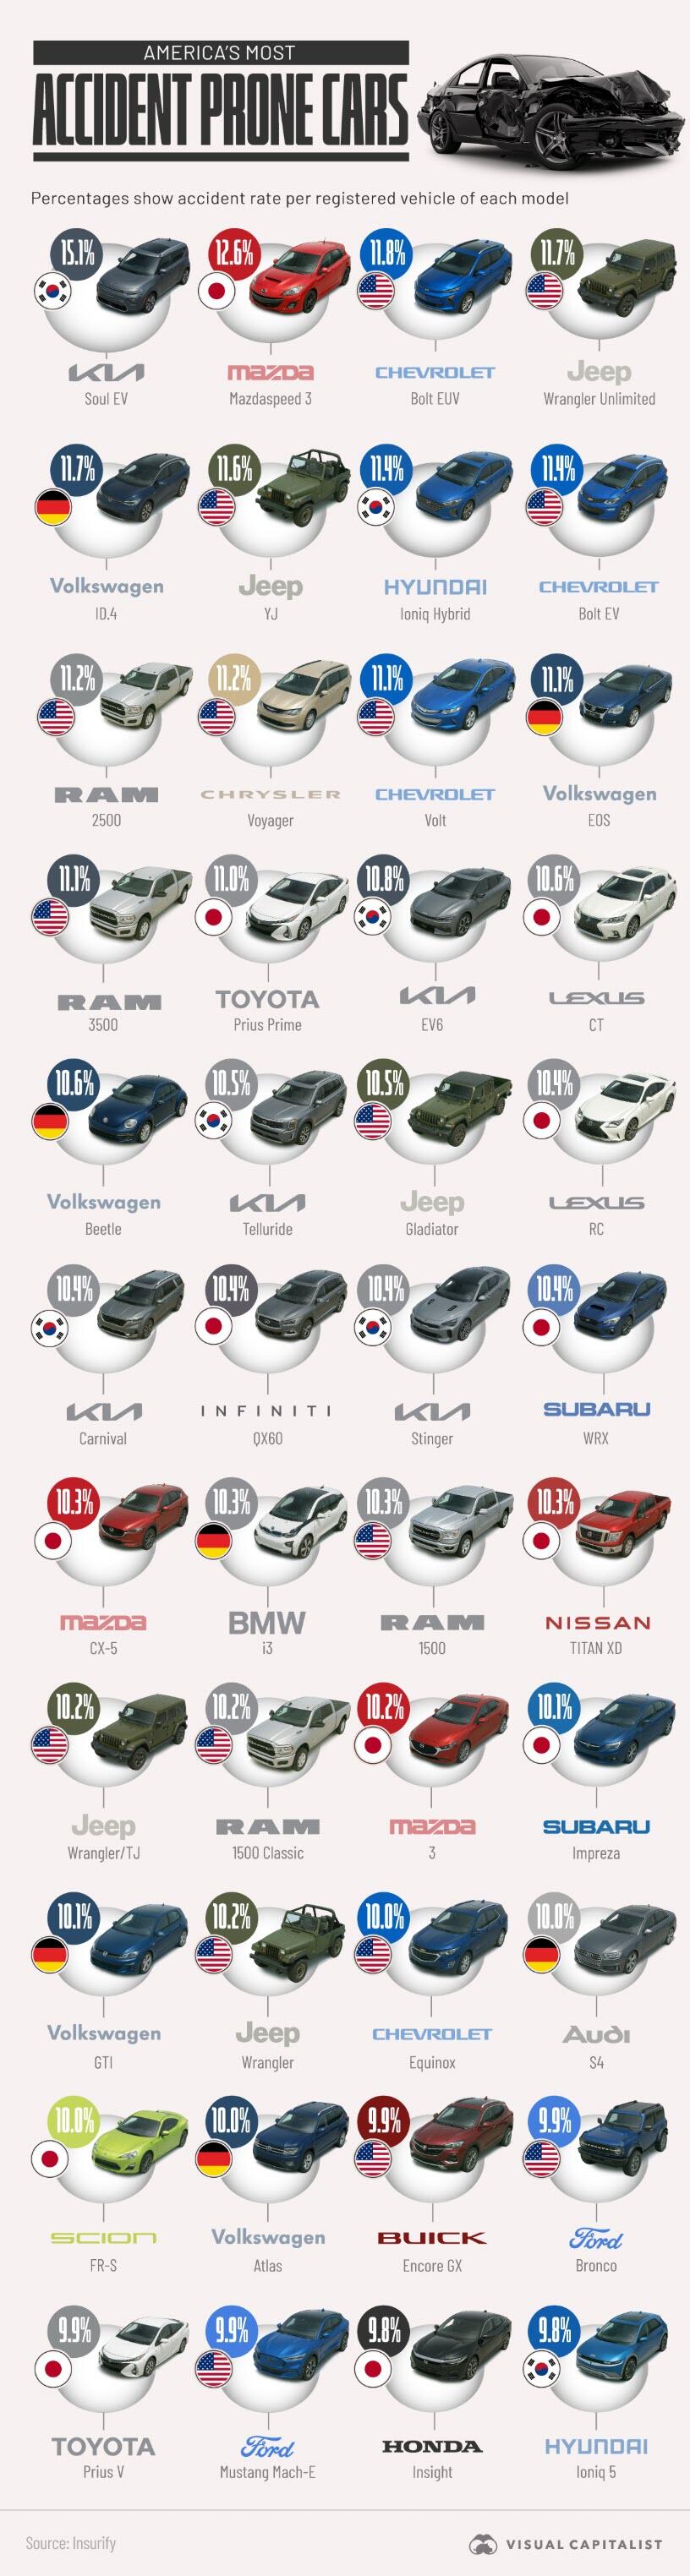
The car models with the highest accident rates in 2024 are listed in the table below. Note that this is a slightly longer top 50 list.
| Rank | Make | Model | Accident Rate (2024) |
|---|---|---|---|
| 1 | 🇰🇷 Kia | Soul EV | 15.1% |
| 2 | 🇯🇵 Mazda | Mazdaspeed 3 | 12.6% |
| 3 | 🇺🇸 Chevrolet | Bolt EUV | 11.8% |
| 4 | 🇺🇸 Jeep | Wrangler Unlimited |
11.7% |
| 5 | 🇩🇪 Volkswagen | ID.4 | 11.7% |
| 6 | 🇺🇸 Jeep | Wrangler / YJ | 11.6% |
| 7 | 🇰🇷 Hyundai | Ioniq Hybrid | 11.4% |
| 8 | 🇺🇸 Chevrolet | Bolt EV | 11.4% |
| 9 | 🇺🇸 RAM | 2500 | 11.2% |
| 10 | 🇺🇸 Chrysler | Voyager | 11.2% |
| 11 | 🇺🇸 Chevrolet | Volt | 11.1% |
| 12 | 🇩🇪 Volkswagen | EOS | 11.1% |
| 13 | 🇺🇸 RAM | 3500 | 11.1% |
| 14 | 🇯🇵 Toyota | Prius Prime | 11.0% |
| 15 | 🇰🇷 Kia | EV6 | 10.8% |
| 16 | 🇯🇵 Lexus | CT | 10.6% |
| 17 | 🇩🇪 Volkswagen | Beetle | 10.6% |
| 18 | 🇰🇷 Kia | Telluride | 10.5% |
| 19 | 🇺🇸 Jeep | Gladiator | 10.5% |
| 20 | 🇯🇵 Lexus | RC | 10.4% |
| 21 | 🇰🇷 Kia | Carnival | 10.4% |
| 22 | 🇯🇵 Infiniti | QX60 | 10.4% |
| 23 | 🇰🇷 Kia | Stinger | 10.4% |
| 24 | 🇯🇵 Subaru | WRX | 10.4% |
| 25 | 🇯🇵 Mazda | CX-5 | 10.3% |
| 26 | 🇩🇪 BMW | i3 | 10.3% |
| 27 | 🇺🇸 RAM | 1500 | 10.3% |
| 28 | 🇯🇵 Nissan | TITAN XD | 10.3% |
| 29 | 🇺🇸 Jeep | Wrangler / TJ | 10.2% |
| 30 | 🇺🇸 RAM | 1500 Classic | 10.2% |
| 31 | 🇯🇵 Mazda | 3 | 10.2% |
| 32 | 🇯🇵 Subaru | Impreza | 10.1% |
| 33 | 🇩🇪 Volkswagen | GTI | 10.1% |
| 34 | 🇺🇸 Jeep | Wrangler | 10.1% |
| 35 | 🇺🇸 Chevrolet | Equinox Limited |
10.0% |
| 36 | 🇩🇪 Audi | S4 | 10.0% |
| 36 | 🇯🇵 Scion | FR-S | 10.0% |
| 38 | 🇩🇪 Volkswagen | Atlas | 10.0% |
| 39 | 🇺🇸 Buick | Encore GX | 9.9% |
| 40 | 🇺🇸 Ford | Bronco | 9.9% |
| 41 | 🇯🇵 Toyota | Prius V | 9.9% |
| 42 | 🇺🇸 Ford | Mustang Mach-E |
9.9% |
| 43 | 🇯🇵 Honda | Insight | 9.8% |
| 44 | 🇰🇷 Hyundai | Ioniq 5 | 9.8% |
| 45 | 🇯🇵 Toyota | FJ Cruiser | 9.8% |
| 46 | 🇩🇪 Audi | A3 | 9.8% |
| 47 | 🇰🇷 Hyundai | Palisade | 9.7% |
| 48 | 🇺🇸 Tesla | Model X | 9.7% |
| 49 | 🇸🇪 Volvo | XC40 | 9.7% |
| 50 | 🇯🇵 Honda | Passport | 9.7% |
Most major automakers have at least one model on the list, but several premium brands—such as Mercedes-Benz, Porsche, and Cadillac—are absent.
Are EVs More Likely to Get Into Accidents?
While we can’t come to a conclusion based on this dataset, it is interesting to note that there are several EV models at the top of the ranking.
This includes the Kia Soul EV (#1), the Chevrolet Bolt EUV (#3), Bolt EV (#8) and Volt (#11), the Volkswagen ID.4 (#5), and the Kia EV6 (#15).
A likely reason for this could be the way electric motors deliver instant torque, which may surprise drivers who are used to the more gradual power curve of gasoline engines.
Here’s something else to consider: research from 2024 found that EVs were 4% more likely to have an at-fault insurance claim compared to gasoline cars.
If you enjoyed today’s post, check out The Best Selling Car in Every State in 2024 on Voronoi, the new app from Visual Capitalist.
Tyler Durden
Mon, 05/19/2025 – 05:45